
There is no question that intangible assets like patents, trademarks and copyrights are foundational for the most valuable public companies, including those in the S&P 500 Index. How foundational is a surprise most executives and investors are unprepared for.
In many cases intangibles comprise 98% or more of the value of leading businesses. Which companies and industries are most dependent on these elusive assets is difficult to discern. Intangible assets like patents, copyrights and trademarks, generally escape public company balance sheets. 18th century accounting rules still used today are partly to blame; so is difficulty valuing intangibles, often a moving target, subject to ownership, timing and competition.
The Center for Intellectual Property Understanding (CIPU) has conducted a research project – “Comparing Intangible Asset Market Value of Leading S&P 500 Companies and Industries” – that expands on previous S&P Index findings that calculate the current intangible asset market value (IAMV) of these companies as a group at 92% intangibles. This figure is up, reports Ocean Tomo reports, from just 13% in 1975; 68% in 1995 and 80% in 2005.
“Today’s corporations are learning to embrace the value from an industrial economy built on tangible assets to a knowledge economy built on intellectual property,” Brian Hinman, former Chief IP Officer at Philips.
CIPU secured the findings for S&P 50 businesses by using the same Ocean Tomo formula (a rough estimate not suitable for licensing or M&A purposes): Company market capitalization (market cap) minus net recorded tangible assets (NTA) equals Intangible Asset Market Value (IAMV).
“Today’s corporations are learning to embrace the value rotation from an industrial economy built on tangible assets to a knowledge economy built on intellectual property,” Brian Hinman, former Chief IP Officer at Philips and a licensing executive at IBM, InterDigital and Verizon, told the Intangible Investor. “For most businesses, patents, brands, data and know-how are the primary drivers of corporate value. They should be understood in the context of their industry.”
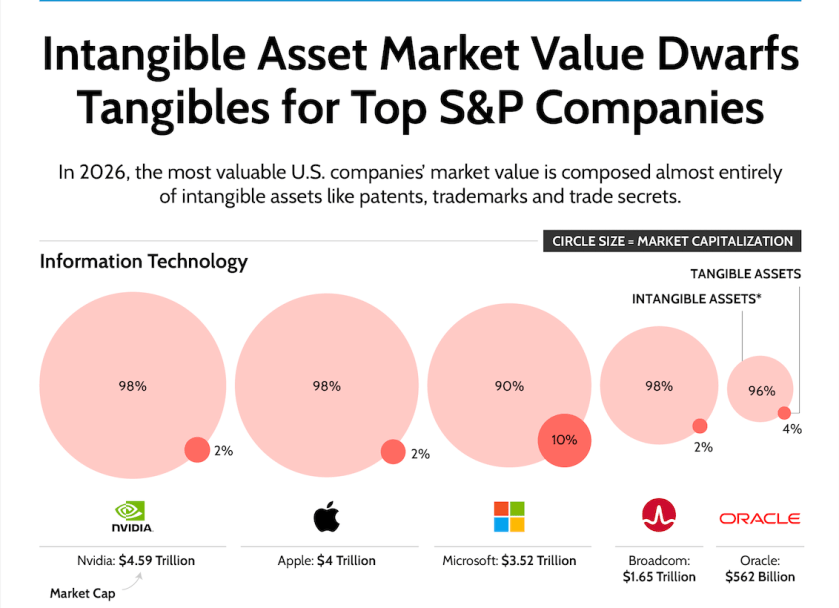
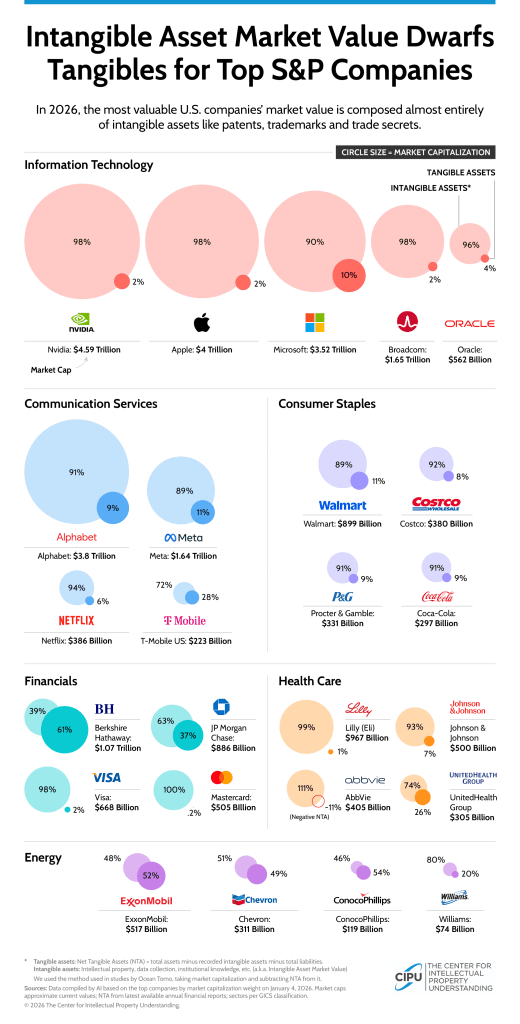
Information Technology is an industry leader when it comes to IAMV. But even within IT there are differences (see illustration). For example, Microsoft’s IAMV is 90% vs. 98% for Nvidia, Apple and Broadcom. Identifying which components within intangible assets are the most valuable, patents vs. brand vs. trade secrets vs. customer data, would be a worthy but challenging task that can help discern more clearly what underlies company value today.
Communications Services leaders include Alphabet, Meta and Netflix, while Consumer Staples businesses, Walmart, Costco, P&G and Coca-Cola all have around 90% intangible asset value, surprisingly close to Communications Services.
“For most businesses, patents, brands, data and know-how are
the primary drivers of corporate value. The should be understood in the context of their industry.”
When we look at Financials, Health Care and Energy, the balance begins to change. It is no doubt because of emphasis on different types of intangible assets in different industries. At Visa and MasterCard, 98% and 100% of their market value is attributed to intangible assets. For Health Care, it is 99% for pharmaceutical company Lilly, which relies heavily on patents, vs. 74% for United Health Care Group, primarily a services provider. Energy is more of a 50-50 tangible-intangible asset split, possibly because of the high price of equipment and oil, and the value of reserves.
The current CIPU project is the first step toward what the educational non-profit hopes will become regular coverage of the role intangible assets plan in industry and specific company value.
For a fuller perspective of intangibles by industry, including Information Technology, Healthcare, Communication Services, Consumer Staples, Energy and Financials, visit my recent Intangible Investor column on IPWatchdog, here.
Image source: Center for IP Understanding
