
Trademarks, patents, copyrights and company trade secrets contribute disproportionately to many U.S. companies’ intellectual asset and stock market value.
Which rights play the most significant role and when remains a mystery because of a lack of financial disclosure. This should concern shareholders and businesses alike.
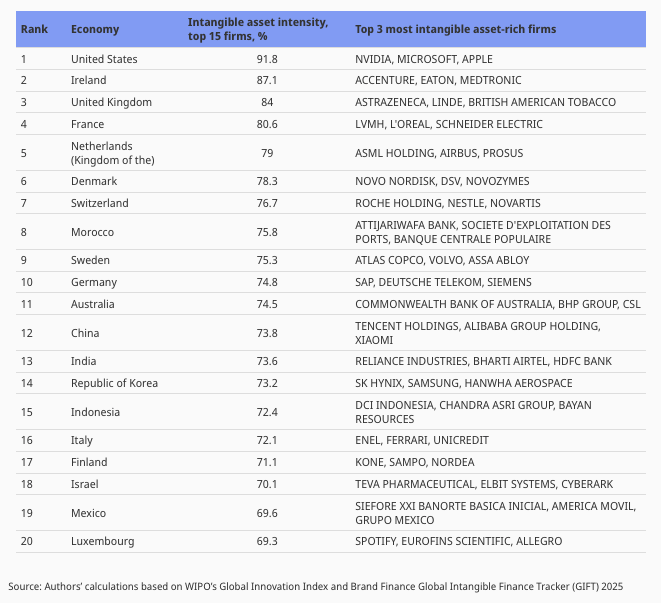
Nvidia, Microsoft and Apple are among the U.S. leaders in Intellectual asset intensity according to the World Intellectual Property Organization (WIPO). They are companies where intangible assets comprise almost the entire market capitalization of the company.
An IP consulting firm, Ocean Tomo, that has been tracking broad Intangible Asset Market Value (IAMV) for the past 30 years, reports that intangibles now comprise 92% of the value of S&P 500 Index companies, up from 32% in 1985.
Intangible assets are non-physical, long-term resources that provide economic value and competitive advantage to a business. They are generally categorized as intellectual property, brand-based assets, relationship-based assets and contractual rights.
This includes Brand & Reputation, The public perception and market power of a business (extremely important for large, consumer-facing businesses); and Customer & Human-Based Assets, Non-contractual relationships and workforce value, such as customer lists (databases), relationships and know-how.
The United States leads as the most intangible asset-intensive economy with the the intangibles of the top 15 firms constituting 90% of the total enterprise value. Ireland, Denmark, the Netherlands, the United Kingdom and France follow closely behind.d
In the US intangible assets underscore their role as the primary driver of corporate value in the world’s largest economy. “NVIDIA is a standout case,” explains WIPO, “whose meteoric rise in valuation, has been fueled by patents covering its proprietary chip architecture that powers advancements in AI, as well as a substantial surge in R&D investment.”
It’s interesting to note that while not leading, less IP-intensive and more tangibles-driven industries like Retail and Food Retail, Oil and Gas and Banking are show significant reliance on intangible assets.
The source of WIPO’s data is the Brand Finance Global Intangible Finance Tracker (GIFT), which uses a residual valuation method to capture “the 79-83% of intangible asset value that accounting standards prohibit from appearing on corporate balance sheets.” This is effectively the same method used by Ocean Tomo, and is major step forward given the virtual absence of intangible assets on public company financial statements.
The Value of global intangible assets reached all-time high of $97.6 trillion in 2025, up 23% from previous year.
The Brand Finance calculation is represented by: Enterprise Value – Tangible Net Assets – Disclosed Intangibles = Implied Intangible Assets.
Whether the residual value method is called Implied Intangible Assets or Intangible Asset Market Value, greater precision would result from more disclosure about IP rights and other intangibles, and more transparency.
Goodwill No Longer Cuts It
Generally Accepted Accounting Principles (GAAP) used in the U.S. does not typically account for intangibles, except for those dubiously classified under “Goodwill” or those that are required to be reported as a result of their acquisition in a transaction. These assets must perform or be written down after a period of time.
According to Center for Intellectual Property Understanding (CIPU) research, practically the entire value of many leading U.S. and other companies is comprised of IAMV or intangible assets. (Full disclosure: I am Chairman of CIPU.) It is the stock price, changes in company products and services and the lack of reporting requirements that serve to endow intangibles with hidden value that is often overlooked and miscalculated.
Impact Measurement
Whether we use Ocean Tomo’s nomenclature – Intellectual Property Market Value – or Brand Finance’s “intensity,” it is an useful but decidedly imprecise method of calculating intangible asset value, as they relate to IP rights. Accurately reflecting IP rights on public company balance sheets is more essential than ever now that share price has so large an impact on intangibles.
Not all IP rights are assets and iconic brands protected under trademarks and that include trade secrets likely outweigh patent value among some larger players. But just how important, when and where are questions that that cannot be answered without more transparency.
Intangible Asset Intensity (WIPO – Brand Finance)
UK’s Brand Finance’s – Global Intangible Finance Tracker
WIPO worked with Brand Finance, a reputable analytics firm which may better suited to understand, trademarked brands as opposed to patents, trade secrets and copyrights. Indeed, brands are more readily understood, valued and transacted, as opposed to other types of IP.
“Our methodology,” explains Brand Finance, “relies on the enterprise value of firms to determine implied intangible asset value because most intangible asset value is not reported by the companies that own it. This is why 83% of estimated total global intangible asset value is unaccounted for in company financial reports.”
Brand Finance rightly considers factors such as the ones below, which significantly impact share price and in-turn, affect intangible asset valued.
- News about company strategy and performance
- Wider industry trends
- General investor sentiment
- Economic conditions that impact share price
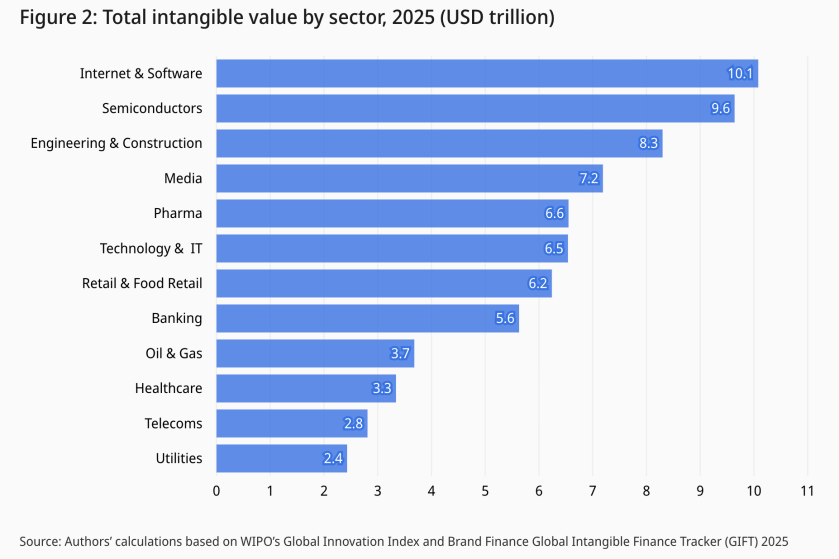
Since 2023, Internet & Software has remained the most intangibles-driven sector with 92% of its total enterprise value comprised of intangible assets, bolstered by the continued demand for digital infrastructure, AI, and software platforms.
In 2025, Tobacco & E-Cigarettes (91%), Semiconductors (88%), Aerospace & Defence (88%), and Cosmetics & Personal Care (86%) have all surpassed Household Products, 2024’s second most intangible sector, with 85% intangibility.
Perhaps more interesting about the WIPO study is that the Engineering & Construction sector ranks third at USD 8.3 trillion, “reflecting how proprietary methodologies, design software, and project management systems have become competitive differentiators.”
Traditionally tangible-intensive sectors now hold significant intangible value: Oil & Gas (USD 3.7 trillion), Healthcare (USD 3.3 trillion), Telecoms (USD 2.8 trillion), and Utilities (USD 2.4 trillion). These sectors increasingly compete on exploration technologies, operational expertise, and grid management software as much as physical infrastructure.
The net-net: Intellectual capital means much more to public companies today than a decade ago. Every business has intangibles that are undisclosed and likely misunderstood. They should be more clearly represented on their financial statements.
Whether or not share price and IP rights together exaggerate or quantify intangible asset value they are strongly linked.
_____________
*** Having worked extensively in investor relations, I have argued for years that public companies need to better inform investors about IP ownership and performance.
Businesses need to disclose more about not only what rights they own, but the role they play, or fail to. This transparency needs to take place whether or not it is required by the regulatory agencies.
For the WIPO intangibles study go here.
For the Brand Finance company data, here.
Image source: WIPO; CIPU
