
Many senior executives and investors are surprised that the value of intangible assets are five times greater than tangibles for most major businesses.
For S&P 500 companies in 2018, tangibles, like real estate and equipment, comprise just 16% of company value, while intangibles, such as IP rights and reputation, are 84%.
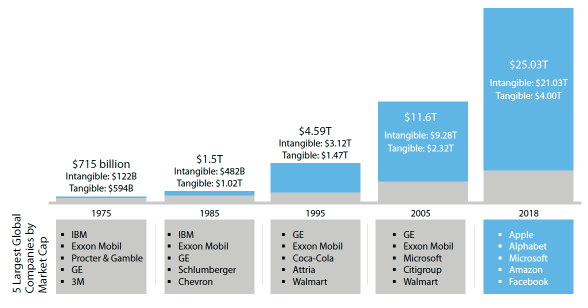
Since information technology exploded in the 1980’s, intangible asset value has been on a rapid rise. It came to lead tangibles before about 1995, when it was reported that intangibles represented more than twice their value. And it has been on a rapid ascent ever since (see graph below).
Tangible vs. Intangible Assets for S&P 500 Companies, 1975-2018
Inadequately Recognized
In the recently published 2019 Intangible Assets Financial Statement Impact Comparison Report, Aon and Ponemon Institute provide data and survey responses that layout just how important intangible assets are today and why, as well as how risk to intangibles has been inadequately recognized.
“The threat to a company’s intangible assets is still not in proper balance with those companies’ insurance protection,” said Lewis Lee, CEO of Aon IP Solutions. “Aon’s 2019 Global Risk Management Survey found that cyber liability and intellectual property risks are among the top business risks facing companies today – much to the credit of the fourth industrial revolution.”
The survey estimates the value of U.S. intangible assets at $20-$25 trillion dollars. Starting in about 1995 intangible assets value began to outweigh PP&E (Property, Plant and Equipment), which has became less of a factor in company valuation as e-commerce, digital assets and other “soft” assets increased.
The importance of raw materials, inventory and equipment is relatively less of a factor today than in the past, when oil companies and auto manufacturers were the leading value generators. Even those engaged in traditional businesses today are relying more on intangibles, like customer lists, IP rights and reputation.
Eight Types of Intangible Assets; Five are IP-Related
 The value of intangibles was more than three times tangibles in 2005. In 2018, intangible asset value of S&P 500 companies was more than five times greater.
The rapid growth coincides with the emergence of the digital economy, with the five largest companies by market cap changing, too (see above). In 1975 they were IBM, Exxon Mobil, P&G, GE and 3M. In 2018, they are Apple, Alphabet, Microsoft, Amazon and Facebook.
The lack of recognition of intangible asset value, says Aon, means that major companies are likely under-insured – on insuring the wrong assets. No doubt, valuing intangibles and calculating the potential risk associated with them is a challenge. But ignoring these secular industry changes is not the answer, either.
“Although few companies have a trade secret theft insurance policy and/or an intellectual property liability policy, by having a greater understanding of the value of their intangible assets compared to their tangible assets, organizations can adjust their allocation of resources accordingly to insure what’s most valuable – their intangible assets,” added Lee.
The Aon report identifies eight major categories of intangible assets, with five areas related to IP and IP rights (see illustration above). IP risk is no longer just about being sued for infringement, it is about what are a particular business’ value-producing assets and understanding the various threats to them.
To receive a complimentary copy of Intangible Assets Financial Statement Impact, go here.
Image source: 2019 Intangible Assets Financial Statement Impact Comparison Report

31 comments