
In the digital world products, services and knowledge travel fast, and where they go so do intangible assets.
Understanding which companies, industries and brands rely on intangible assets and have experienced incredible growth since 1985 is key to envisioning the future.
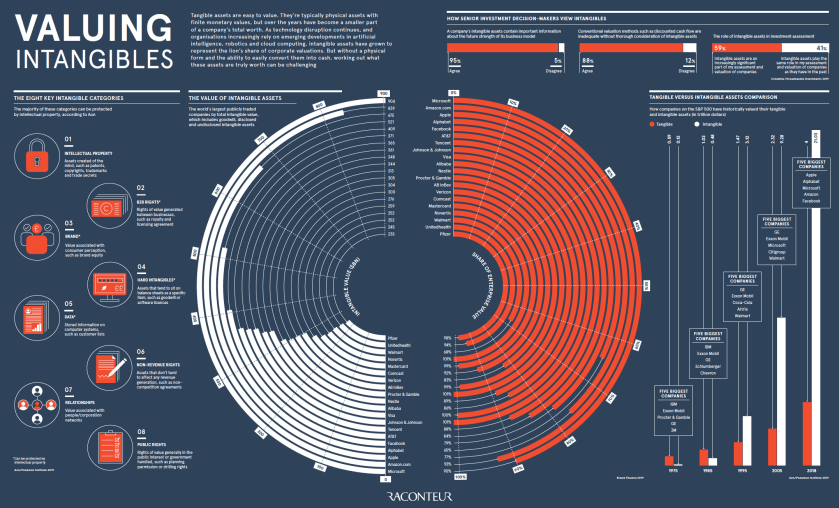
S&P 500 companies today own more than five times the amount of intangible assets as tangibles. Assets like IP, data and brand have surpassed real estate and inventory as primary drivers of business value. In 1985, tangibles were more than twice the size of intangibles at S&P companies.
Back then the value leaders were IBM, Exxon, GE, Schlumberger and Chevron.
To what can we attribute the sea change? Technology, not only technology companies and brands, but the emphasis on digitally derived products and services. For credit card company Visa and drug giant Johnson & Johnson 100% of their enterprise value is attributed to intangibles.
Getting Your Arms Around Intangibles
The chart below, courtesy of Raconteur in the UK and Visual Capitalist in Canada, illustrates the nature and growth of intangible assets.

For the full screen version.
Eight types of intangibles are noted. The descriptions these categories on the chart are worth reading. They likely include terms and items most people are unfamiliar with or did not consider as significant.
- Intellectual Property
- B2B
- Brand
- Hard Intangibles
- Data
- Non-Revenue Rights
- Relationships
- Public Rights
- Digital-centric sectors, such as internet & software and technology & IT, are heavily reliant on intangible assets. Brand Finance, which produces an annual ranking of companies based on intangible value, has companies in these sectors taking the top five spots on the 2019 edition of their report.

Image source: Raconteur, VisualCapitalist.com
